Accelerator Laboratory
The Accelerator Laboratory houses a 2 MV tandem Van de Graaff accelerator with sputter ion source which is used for basic and applied research. The laboratory is the centerpiece of atomic, molecular, radiation, and optical (AMRO) research at East Carolina University. The research areas currently active are:
- Studies of ionization and excitation process in ion-atom, ion-molecule, and ion-surface interactions.
- Effects of electronic structure of “dressed” ions on ionization and charge transfer processes important to the assessment of charged particle track structure and electron transport in tissue-like material.
- Interaction cross sections studied through measurements of the energy and angular distribution of electrons ejected by the impact of fast ions and neutral particles with gas and solid targets.
- Trace elements analysis using proton induced X-ray emission analysis (PIXE) as a research component for studies in such diverse fields as anthropology, archaeology, biology, geology, and medicine.

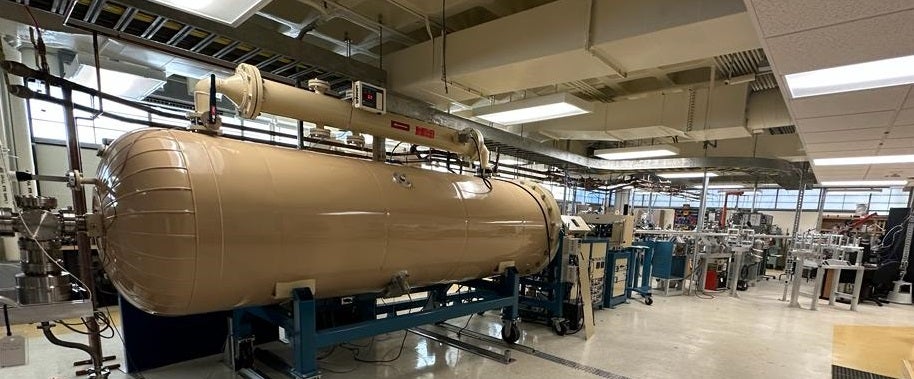
The Accelerator Laboratory is home to the university’s tandem Pelletron accelerator, and is the centerpiece of AMRO research at ECU.
The laboratory uses a wide range of specialized equipment, including various types of radiation detectors for the measurement of charged particles, VUV, X-rays, and gamma rays. NIM electronics are used for signal processing, while CAMAC is used for data acquisition, analysis, and control.

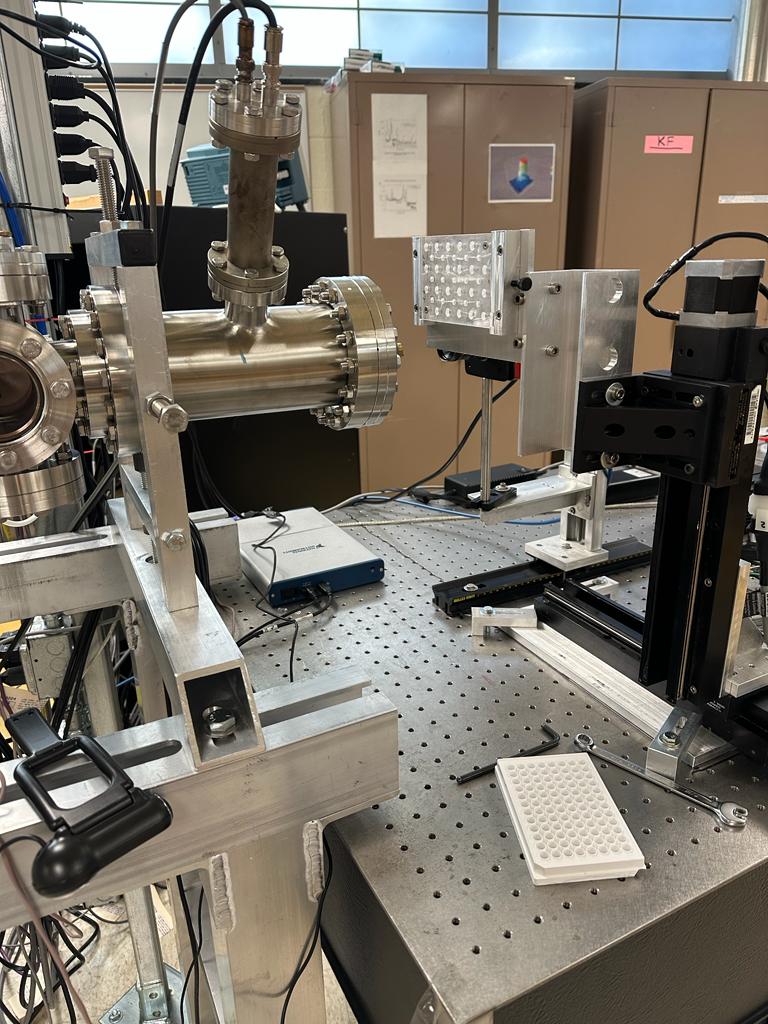
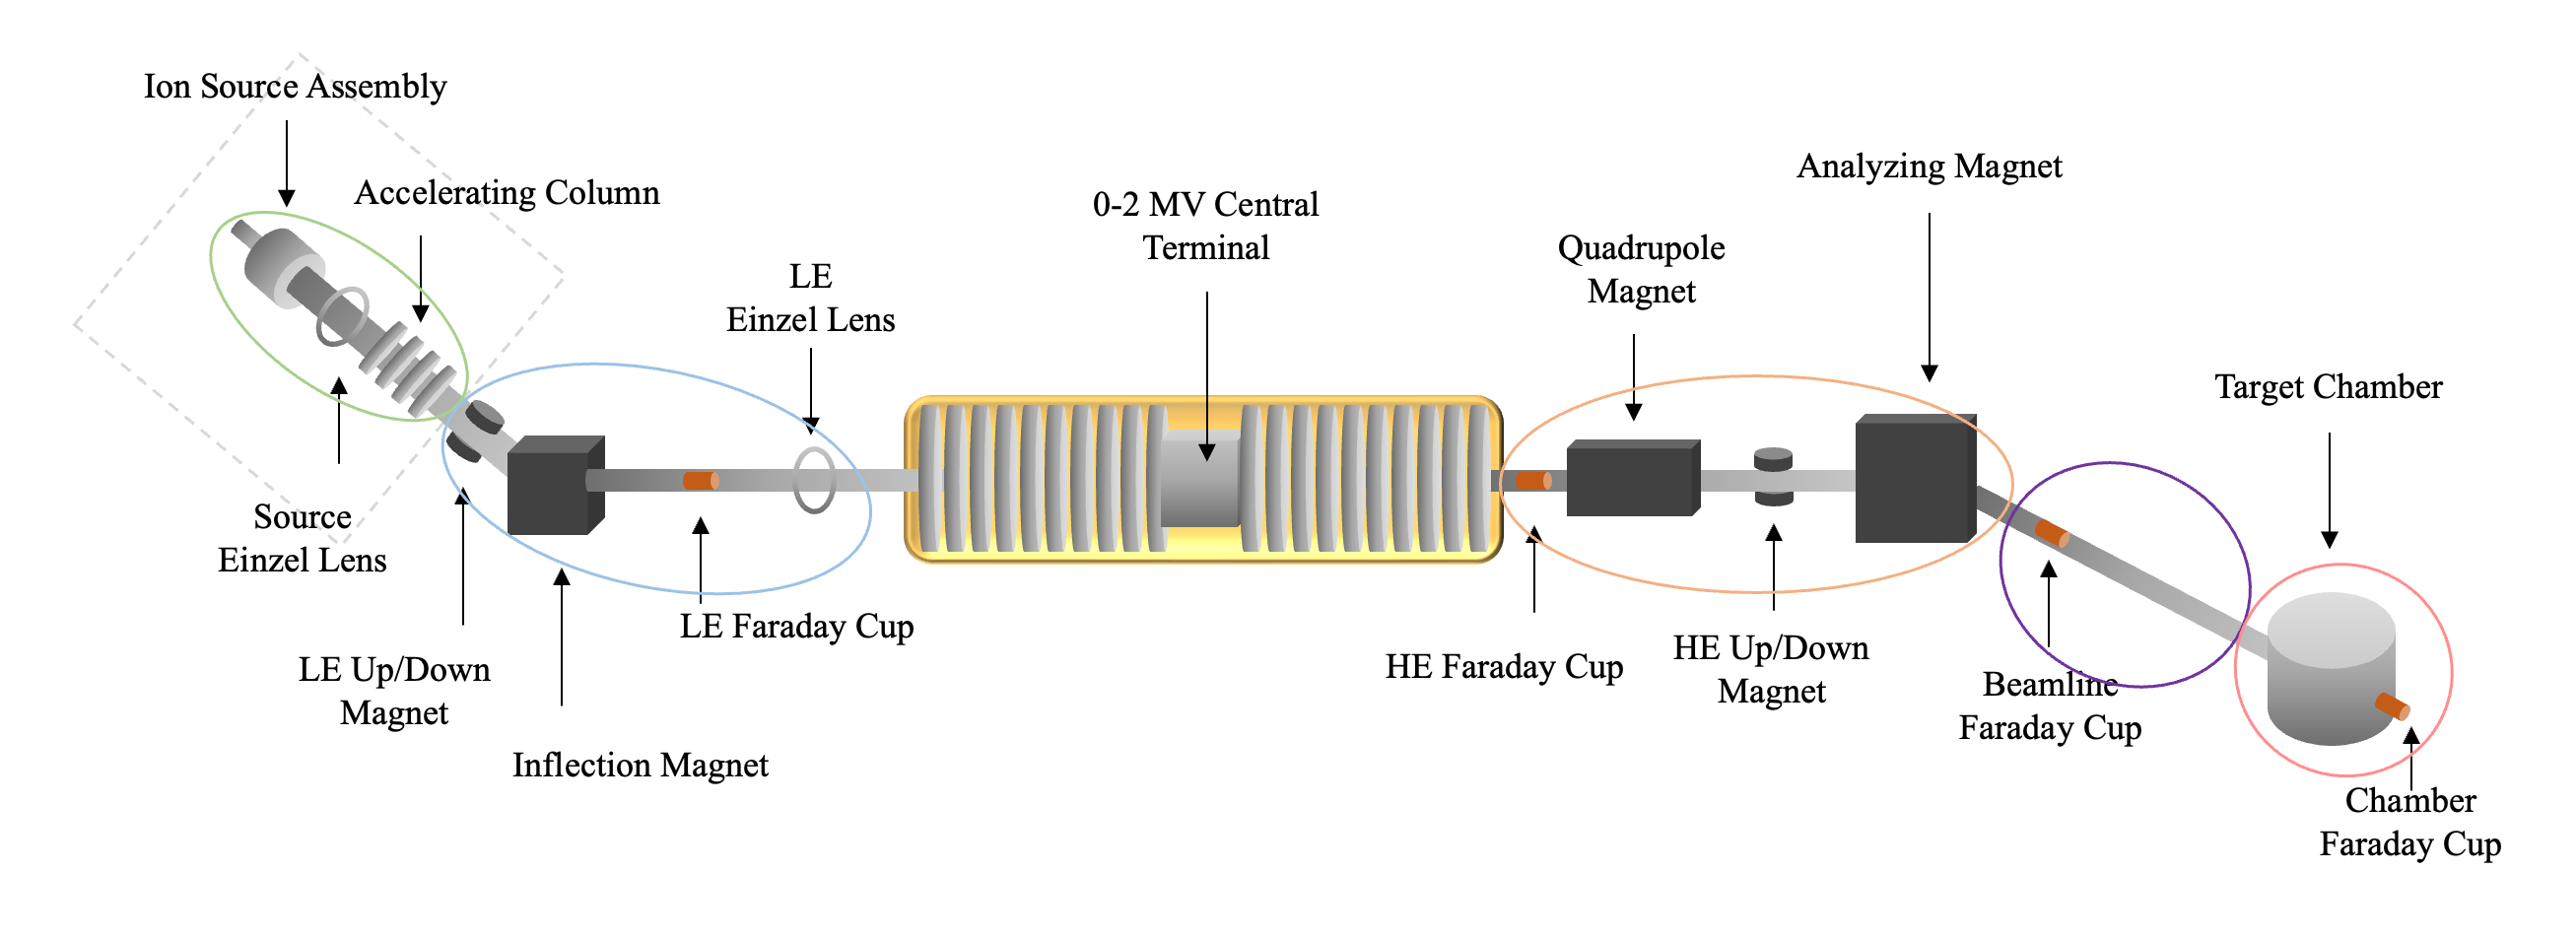
Illustration showing the ion source together with the low energy (LE), high energy (HE), and experimental beamlines.
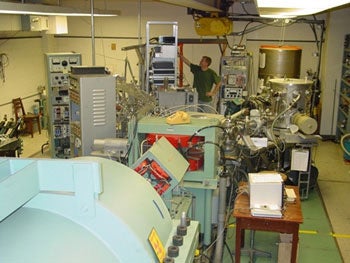
Legacy Equipment

Accelerator Laboratory data gathering and computing equipment (November 1980). Photo credit: David Hinnant.
The main computer was a DEC PDP-11/23 running RT-11. The PDP would boot from a switch panel, located bottom-left in the first rack (L-R). You’d key-in flip the switches for the bootloader (173000 octal) and then hit the Boot toggle. An ASCII interface came after that initial loader. The PDP had 12 KB of magnetic-core ram. This is where all the signal data went as it was being collected. There was a total of 24 KB, I believe. The OS and all the device drivers were written in assembler, or FOCAL, which was the native high level language for the PDPs. FOCAL supported direct-mapped memory, so if you (for example) peeked at address 176012, you’d see it at the user level. Forth was also supported, and we ran the Caltech OVRO version. I wrote one of the first graphics plotting drivers for a 512×512 pixel display.
Above in rack 1 (L-R) was a triple cassette deck for data collection and storage, boot loaders, different operating systems, etc. Behind the black panel were a number of backplanes and various I/O cards for all the sensors in the data collection stations. I got to be handy with wire wrap tools.
Rack 2 has all the DAC and signal processing gear. At the bottom is a double 8″ floppy. This was the main method for all storage and replaced the cassette deck.
Rack 3 has more signal/voltage controls that might need to be tweaked from the chair. The oscilloscope was the main graphical display and had better resolution than the 512×512 thing I kicked around.
Far right is the main human-machine interface: the ASR-33 Teletype. It ran at 110 baud. There’s a paper tape punch/reader on the left side of the keyboard. I would punch out data runs from the lab onto the paper tape and walk the paper spindle over to the computer center located in Austin next door. I’d then read them into the Burroughs B6800 and run a Gaussian best-fit program. The resulting graph would be “ASCII art” on a 132 column line printer from the mainframe.
Text credit: David Hinnant (BS, 1981).


